2010 NATURAL GAS STATISTICS,
BRITISH COLUMBIA (BC)
BRITISH COLUMBIA (BC)
Statistical data on natural gas gathered volumes, production, production loss, domestic and export consumption, can be found on the internet at the BC Ministry of Energy & Mines website:
As all provincial governments are legislatively required to report these, and many other statistics, to the federal government, this information can also be found, through more difficulty, at the federal Canadian statistics website. But trying to make sense of the BC data, when it is finally obtained, presents further difficulty in intrepretation, given the unspecified quantities of import data from the Yukon, Northwest Territories blended into the BC gas pool.
Energy Statistics Handbook
http://www.statcan.gc.ca/bsolc/olc-cel/olc-cel?catno=57-601-XWE&lang=eng
Crude Oil and Natural Gas
http://www.statcan.gc.ca/subject-sujet/subtheme-soustheme.action;jsessionid=EF6AA262849C3762B9AFAD
1060EF3924?pid=1741&id=2026&lang=eng&more=0
http://www.statcan.gc.ca/bsolc/olc-cel/olc-cel?catno=57-601-XWE&lang=eng
Crude Oil and Natural Gas
http://www.statcan.gc.ca/subject-sujet/subtheme-soustheme.action;jsessionid=EF6AA262849C3762B9AFAD
1060EF3924?pid=1741&id=2026&lang=eng&more=0
Under the BC site (above) are several other option pages for related natural gas statistics. Perhaps the most relevant spreadsheet is the option category under Monthly Statistics, where you will find annual information from 2007 to 2010:
A word of caution. When viewing the spreadsheet data for the operating year 2010, the net production data is not presented in a straightforward manner. When sorting out this confusion with the BC Ministry of Energy, staff reported that the total distribution of refined gas was actually 27,815,471,760 cubic metres, not the figure of 28,951,935,000 cubic meters (combining the domestic and export data in the spreadsheet, and then subtracting gas lost during distribution and export). Furthermore, because the data comes from dozens of producers, gas plants and utilitites generated from internal records of the companies that own the data, there are small discrepancies in the final data, perhaps in the neighbourhood of 283,000,000 cubic metres.
Given the forecast by numerous energy companies of future proposed output of deep shale natural gas from northeast British Columbia, BC's annual gross gas production is set to increase, as well as annual increases of export gas.
Conversion Units
1,000 cubic metres of gas volume equals 35,310.73 cubic feet of gas volume.
THE GROSS METHOD AND 2010 DATA
There are two methods of making statistical comparisons for natural gas production in BC:
- referring to gross production (measuring the amount off all raw gas gathered from the earth, all lost gas, and all refined gas)
- referring to net production (the gas actually delivered to end users after the gas is refined and all losses of gas are measured).
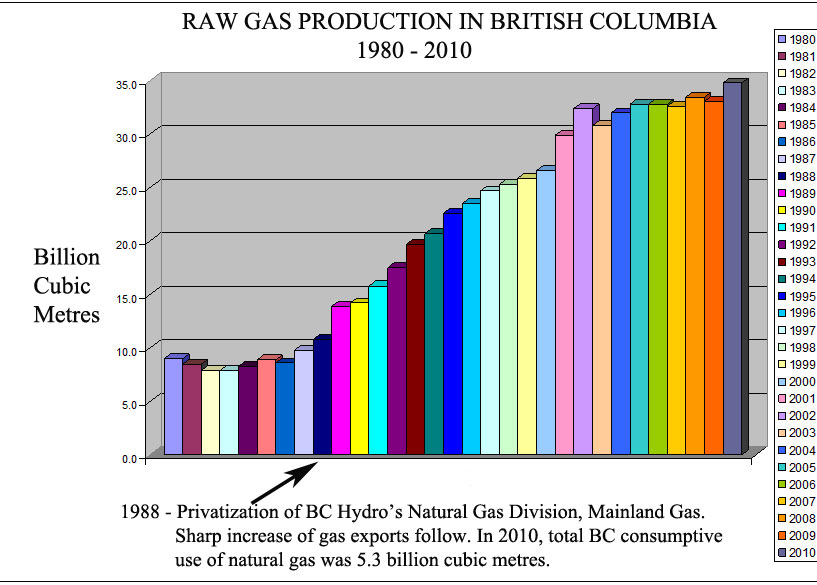
Out of a total of 34,795,623,800 cubic metres of raw gas (1,228,659,032,486 cubic feet) gathered from BC's geology in the 2010 operating year:
- 7,262,430,900
cubic metres was actually lost for various reasons (see below), which
represents about 21% of the gross total. This is a signficantly large
loss of raw and refined gas.
- 23,669,591,500 cubic metres was exported to Alberta and the United States. This figure is not accurate, and should be lowered, because it does not include gas lost during pipeline delivery. As it stands, this inaccurate data represents about 68% of the gross total.
- 5,282,344,900 cubic metres was used domestically for BC industrial, commercial and residential users. This figure is not accurate, and should be lowered, because it does not include gas lost during pipeline delivery. As it stands, this inaccurate data represents about 15% of the gross total.
(Data Source: BC Ministry of
Energy & Mines, raw gas production data.
Deep Shale gas production in northeast BC is just getting underway in 2010.)
Deep Shale gas production in northeast BC is just getting underway in 2010.)
BC NATURAL GAS CONSUMPTION DATA FOR
2010
(NON-EXPORT)
There are four distribution groups of Marketable Gas Distribution within BC, under a general category called Domestic use, each of which has three categories, Industrial, Commercial, and Residential, with one exception, a separate category for one group called Direct Sales.
The four groupings are divided between the two gas distribution companies, Fortis BC (formerly Terasen Gas, and previous to that Centra Gas) and Pacific Northern Gas Ltd. (On March 1, 2011, Fortis BC assumed its new operations in the takeover of Terasen Gas.) Under Fortis BC are two groupings, Vancouver Island and the Mainland. Under Pacific Northern Gas are two groupings, the Northeast delivery (Ft. St. John, etc) and areas generally west of Prince George.
Pacific Northern, through former partnerships, is awaiting the National Energy Board's decision this summer, 2011, to approve final considerations for the proposed LNG plant in Kitimat and the new 36 inch pipeline to be built across BC to steer new deep shale dirty gas from northeast BC for export.
FORTIS BC - MAINLAND (Cubic Metres)
| Direct
Sales |
1,548,957,000
|
| Industrial |
69,095,000 |
| Commercial |
1,000,886,000 |
| Residential |
1,734,387,000 |
| Total |
4,353,225,000 |
FORTIS
BC
-
VANCOUVER
ISLAND (Cubic
Metres)
| Industrial |
484,232,400 |
| Commercial |
179,731,200 |
| Residential |
117,677,800 |
| Total |
781,641,400 |
PACIFIC
NORTHERN
GAS
LTD
(Cubic Metres)
| Industrial |
6,252,000 |
| Commercial |
23,576,600 |
| Residential |
30,583,700 |
| Total |
60,412,300 |
PACIFIC NORTHERN GAS, NORTHEAST (Cubic
Metres)
| Industrial |
3,794,000 |
| Commercial |
40,522,800 |
| Residential |
42,749,400 |
| Total |
87,066,200 |
INDUSTRIAL, COMMERCIAL, RESIDENTIAL TOTALS
(Cubic Metres)
(Cubic Metres)
| Direct
Sales |
1,548,957,000 |
| Industrial |
563,373,400 |
| Commercial |
1,244,716,600 |
| Residential |
1,925,397,900 |
| Total |
5,282,344,900 |
BC NATURAL GAS EXPORT DATA
FOR 2010
Currently, there are three categories under separate pipelines for export of BC produced gas, two of which export gas to the United States, and the third to Alberta. The two to the United States are the Westcoast through Huntington, and Alliance to Chicago pipeline routes, and the Alberta bound is the Nova pipeline.
In early February, 2010, the National Energy Board approved another pipeline into Alberta from the Horn River Basin in northeast BC, the 36 inch diameter, Nova Gas Horn River pipeline. When that pipeline comes into operation, more gas will flow towards Alberta.
Should the Kitimat LNG plant be approved in the summer of 2011 by the National Energy Board, much more gas will be exported via a new 36 inch diameter Pacific Trails Pipeline linked to North America's first LNG terminal facility in 40 years.
NATURAL GAS EXPORTS (Cubic Metres)
| Westcoast
Through
Huntington |
8,126,151,600 |
| Alliance
to
Chicago |
5,580,528,600 |
| Nova
to
Alberta |
9,962,911,300 |
| Total |
23,669,591,500 |
BC NATURAL GAS LOSSES FOR 2010
The BC Ministry of Energy's natural gas spreadsheet for 2010 has three categories of gas losses:
- Total Field Loss
- Total Plant Loss
- Loss During Distribution and Export
Under the heading Field Disposition, are the following categories that comprise Total Field Loss in the following table:
| Field
Flared |
52,517,600 |
| Field
Vented |
27,205,900 |
| Fuel-Field |
1,181,081,100 |
| Metering
Difference
-
Field |
127,686,000 |
| Injected
Gas
-
for
enhanced oil recovery |
47,112,000 |
| Injected
Gas
-
produced
and injected into storage |
514,365,200 |
| Other
Dispositions |
92,808,500 |
| Field
Sales |
27,807,000 |
| Total
Field
Loss |
2,070,583,300 |
Total Plant Loss (Cubic Metres)
Under the heading Plant Disposition, are the following categories that comprise Total Plant Loss in the following table:
| Gathering
System
Flared |
6,574,800 |
| Gathering
System
Fuel |
22,813,800 |
| Gathering
System
Metering
Difference |
-1,449,900 |
| Gathering
System
Other |
0.0 |
| Plant
Fuel |
1,170,815,400 |
| Plant
Flared |
52,059,400 |
| Plant
Waste
and
Metering
Difference |
49,454,300 |
| Plant
Other |
75,285,700 |
| Storage
Gas |
0.0 |
| Processing
Shrinkage
-
Acid
Gas |
2,224,704,600 |
| Processing
Shrinkage
-
Natural
Gas Fluids |
602,873,100 |
| Return
Fuel |
180,246,200 |
| Total
Plant
Loss |
4,383,377,440 |
Loss During Distribution and Export
A total 808,470,200 cubic metres of gas were lost in this category.
Total Losses (Cubic Metres)
| Field
Loss |
2,070,583,300 |
| Plant
Loss |
4,383,377,440 |
| Distribution
and
Export |
808,470,200 |
| Total |
7,262,430,900 |